Skip to content

Thermal comfort and airflow simulations

Thermal comfort (PMV and PPD), airflow in halls and swimming pools, day-to-day car park ventilation. We compute in Ansys Fluent and FDS.

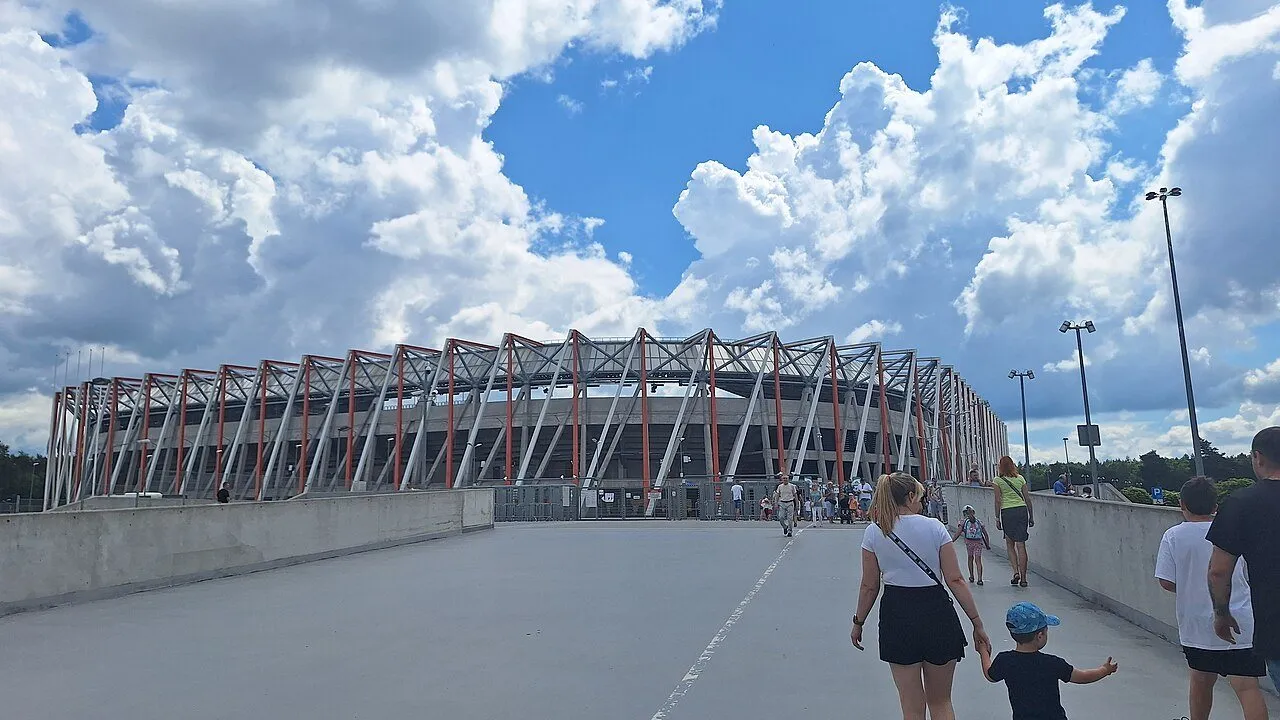
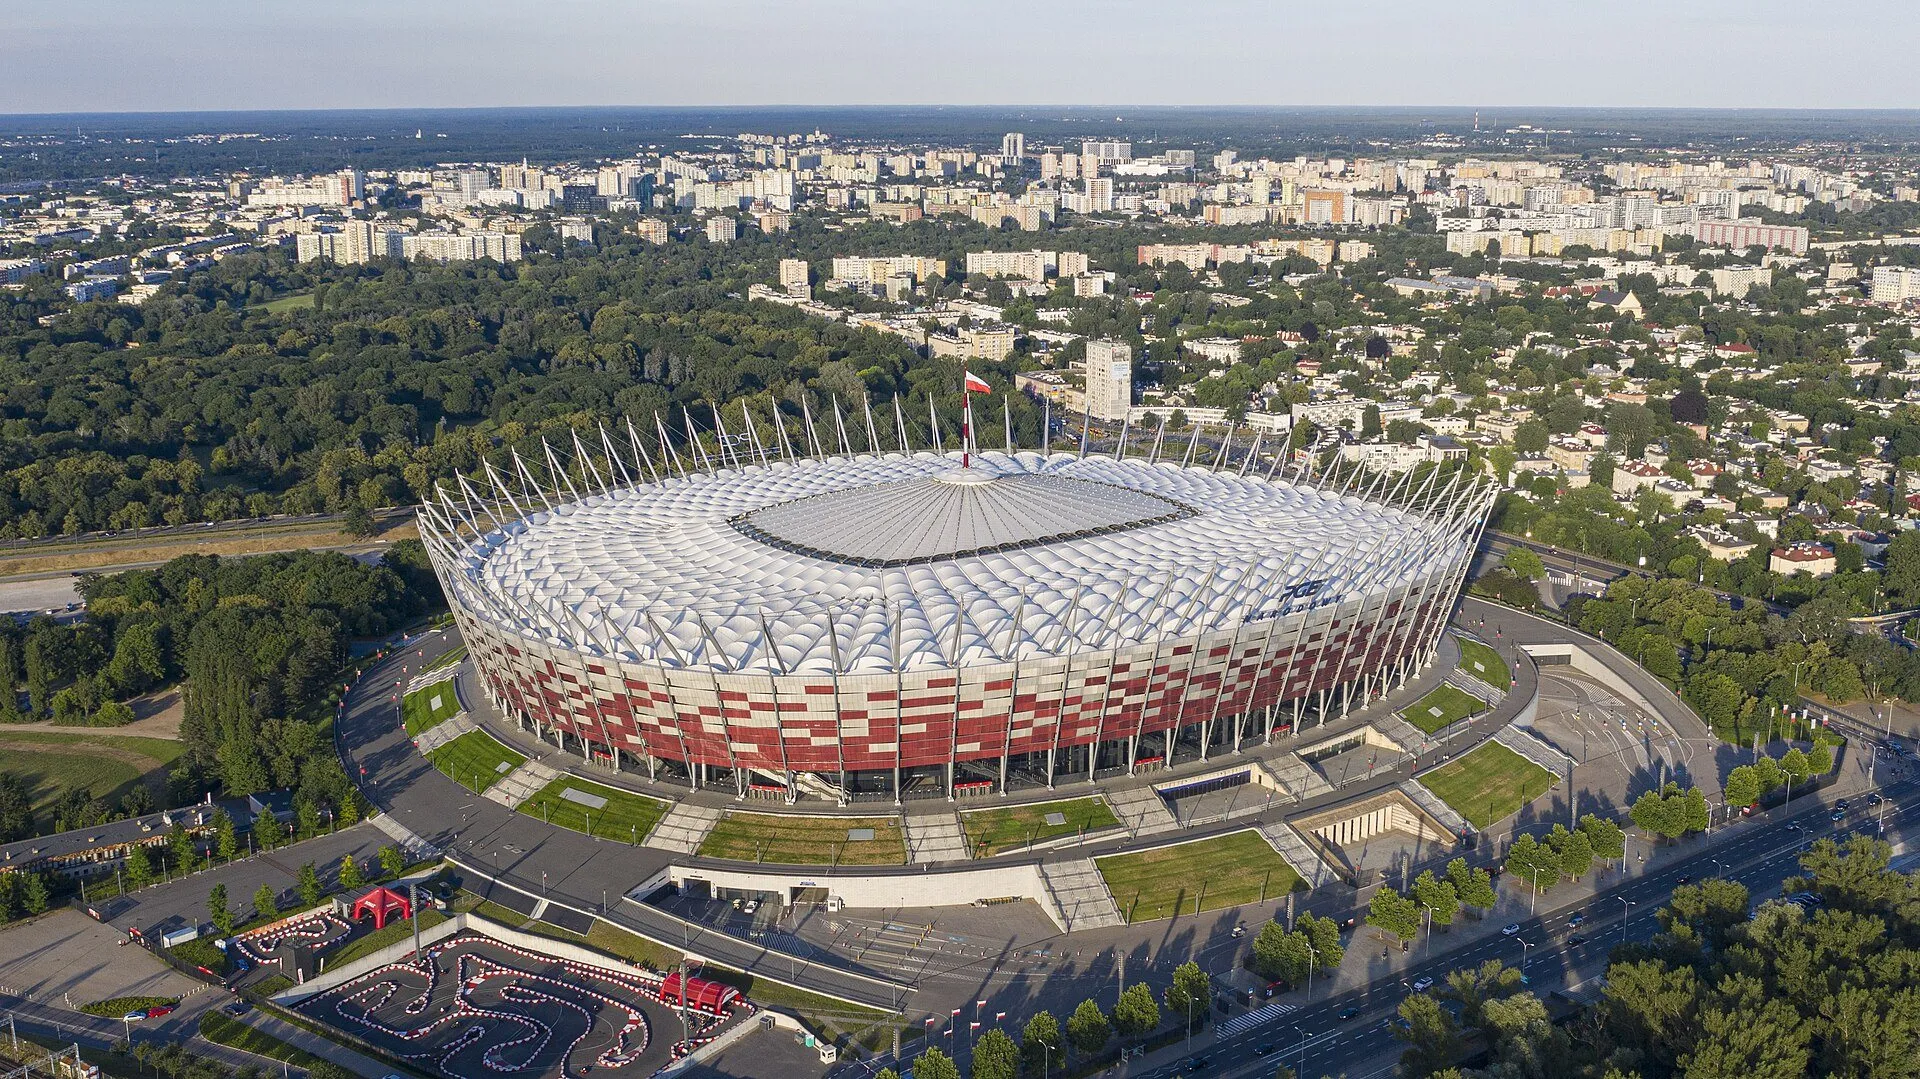
Exterior of Białystok Municipal Stadium with its stands and roof
Chorten Arena Białystok · Wind comfort in the stands

Projects: comfort, halls and day-to-day ventilation

Stadiums, production halls, swimming pools and car parks where we modelled airflow without a fire. Click a card to see the scope.

  • Exterior of Białystok Municipal Stadium with its stands and roof

    Chorten Arena

    Białystok

    Białystok2026

    Chorten Arena

    Football stadium, 22,000 seats

    Analysis
    Wind comfort in the stands
    Tool
    Ansys Fluent
    Seats
    22,432
    Rebuilt
    2014

    What we checked

    • Wind flow over the stands
    • Spectator comfort in the stands
    • Evacuation time from the stands

    Photo: Wikimedia Commons, photo by Rakoon, CC0

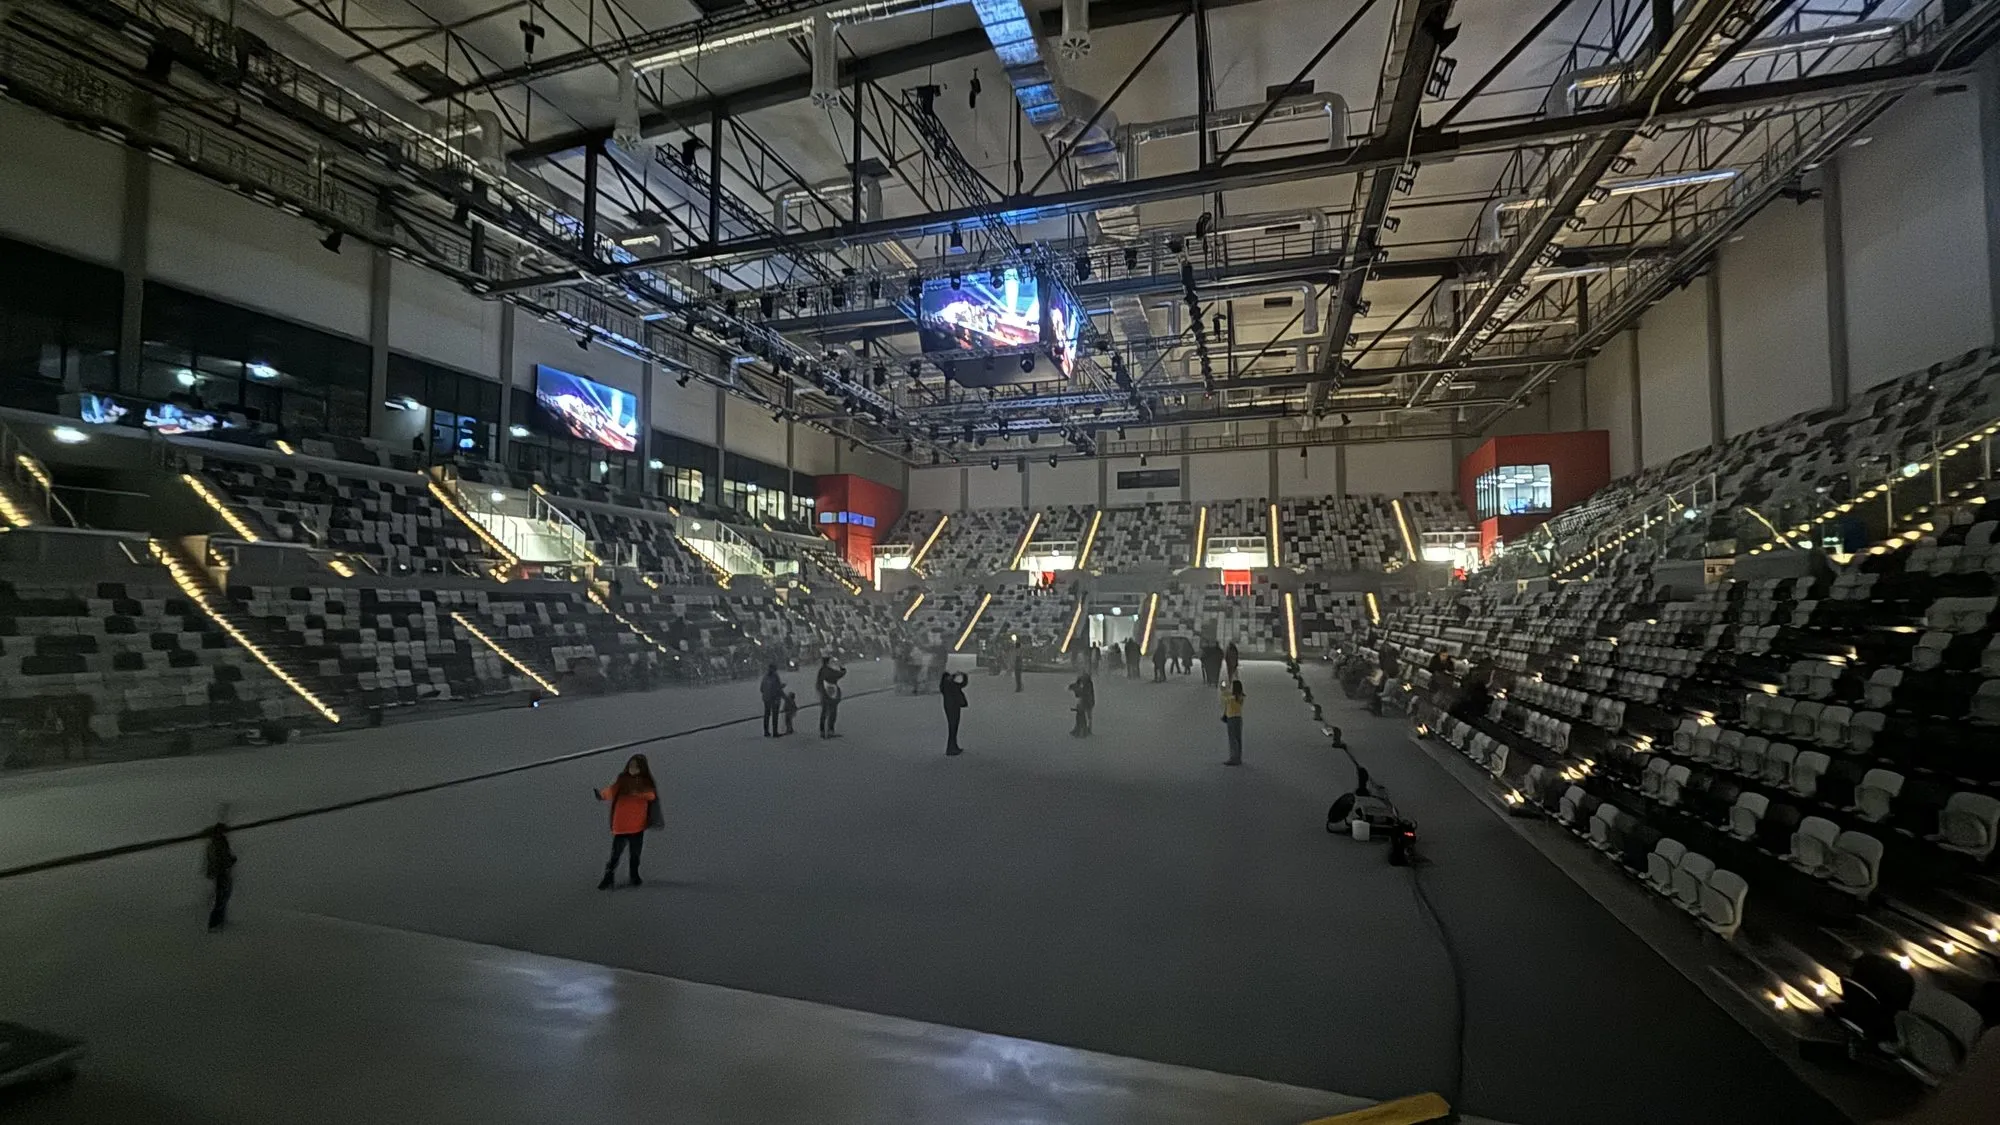
  • Interior of Arena Gorzów with the stands and court on opening day

    Arena Gorzów

    Gorzów Wielkopolski

    Gorzów Wielkopolski2022–2024

    Arena Gorzów

    Sports and entertainment arena, 5,050 seats

    Analysis
    Arena general ventilation
    Tool
    FDS
    Seats
    5,050
    Opened
    2023

    What we checked

    • Airflow distribution in the arena
    • General ventilation of the seating and arena floor
    • Comfort conditions in the stands

    Photo: Wikimedia Commons, photo by User:DXgorzow, CC BY-SA 4.0

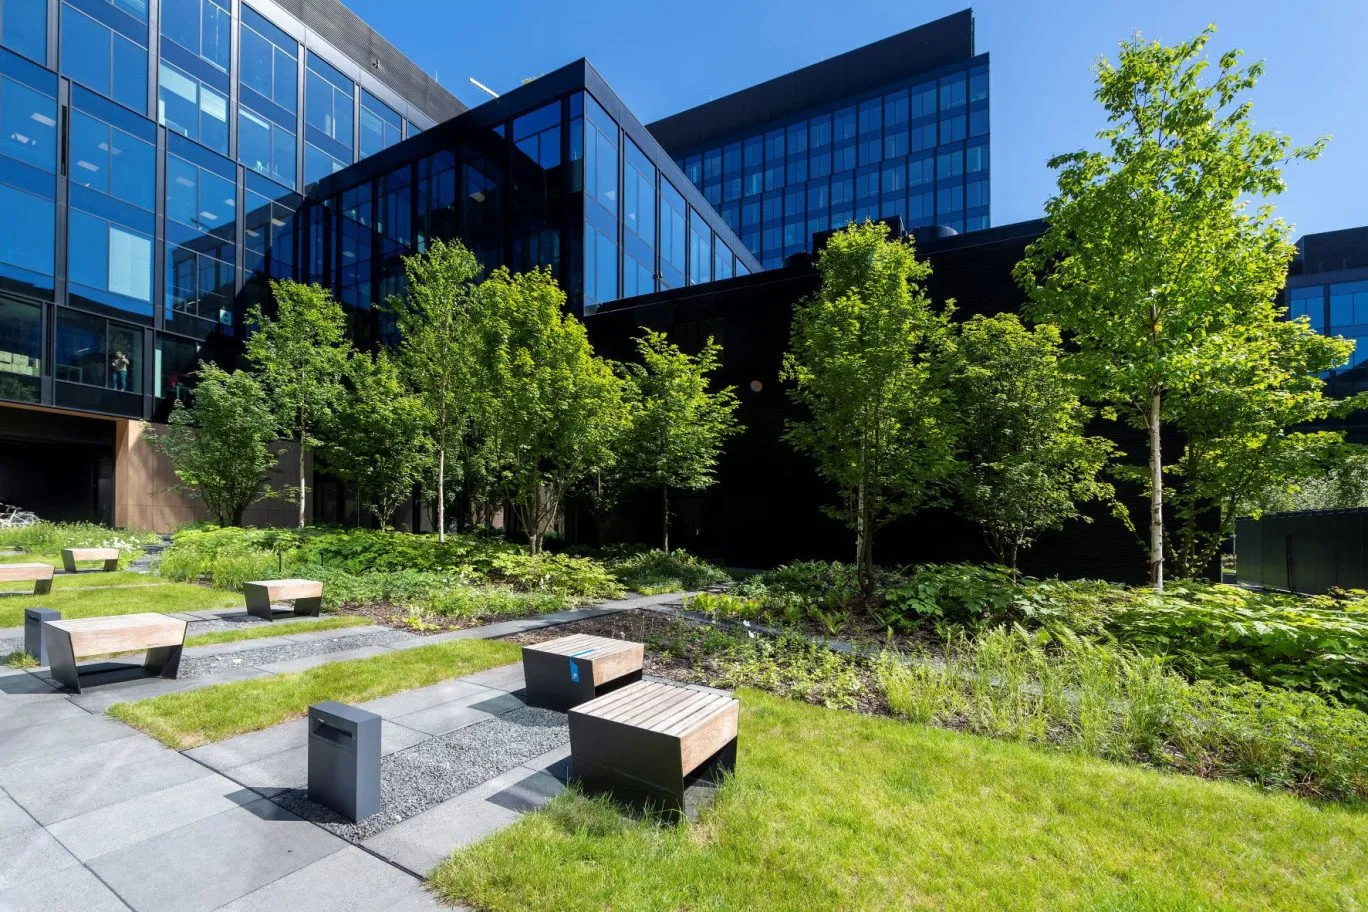
  • LIXA office complex on Kasprzaka Street in Warsaw's Wola district

    LIXA

    Warsaw

    Warsaw2021

    LIXA

    Office complex, 5 buildings

    Analysis
    Car park general ventilation
    Tool
    FDS
    Floor area
    approx. 77,000 m²

    What we checked

    • CO and LPG dilution in the car park
    • Airflow distribution in the car park
    • Jet fan ventilation performance

    Photo: Yareal Polska (developer's materials)

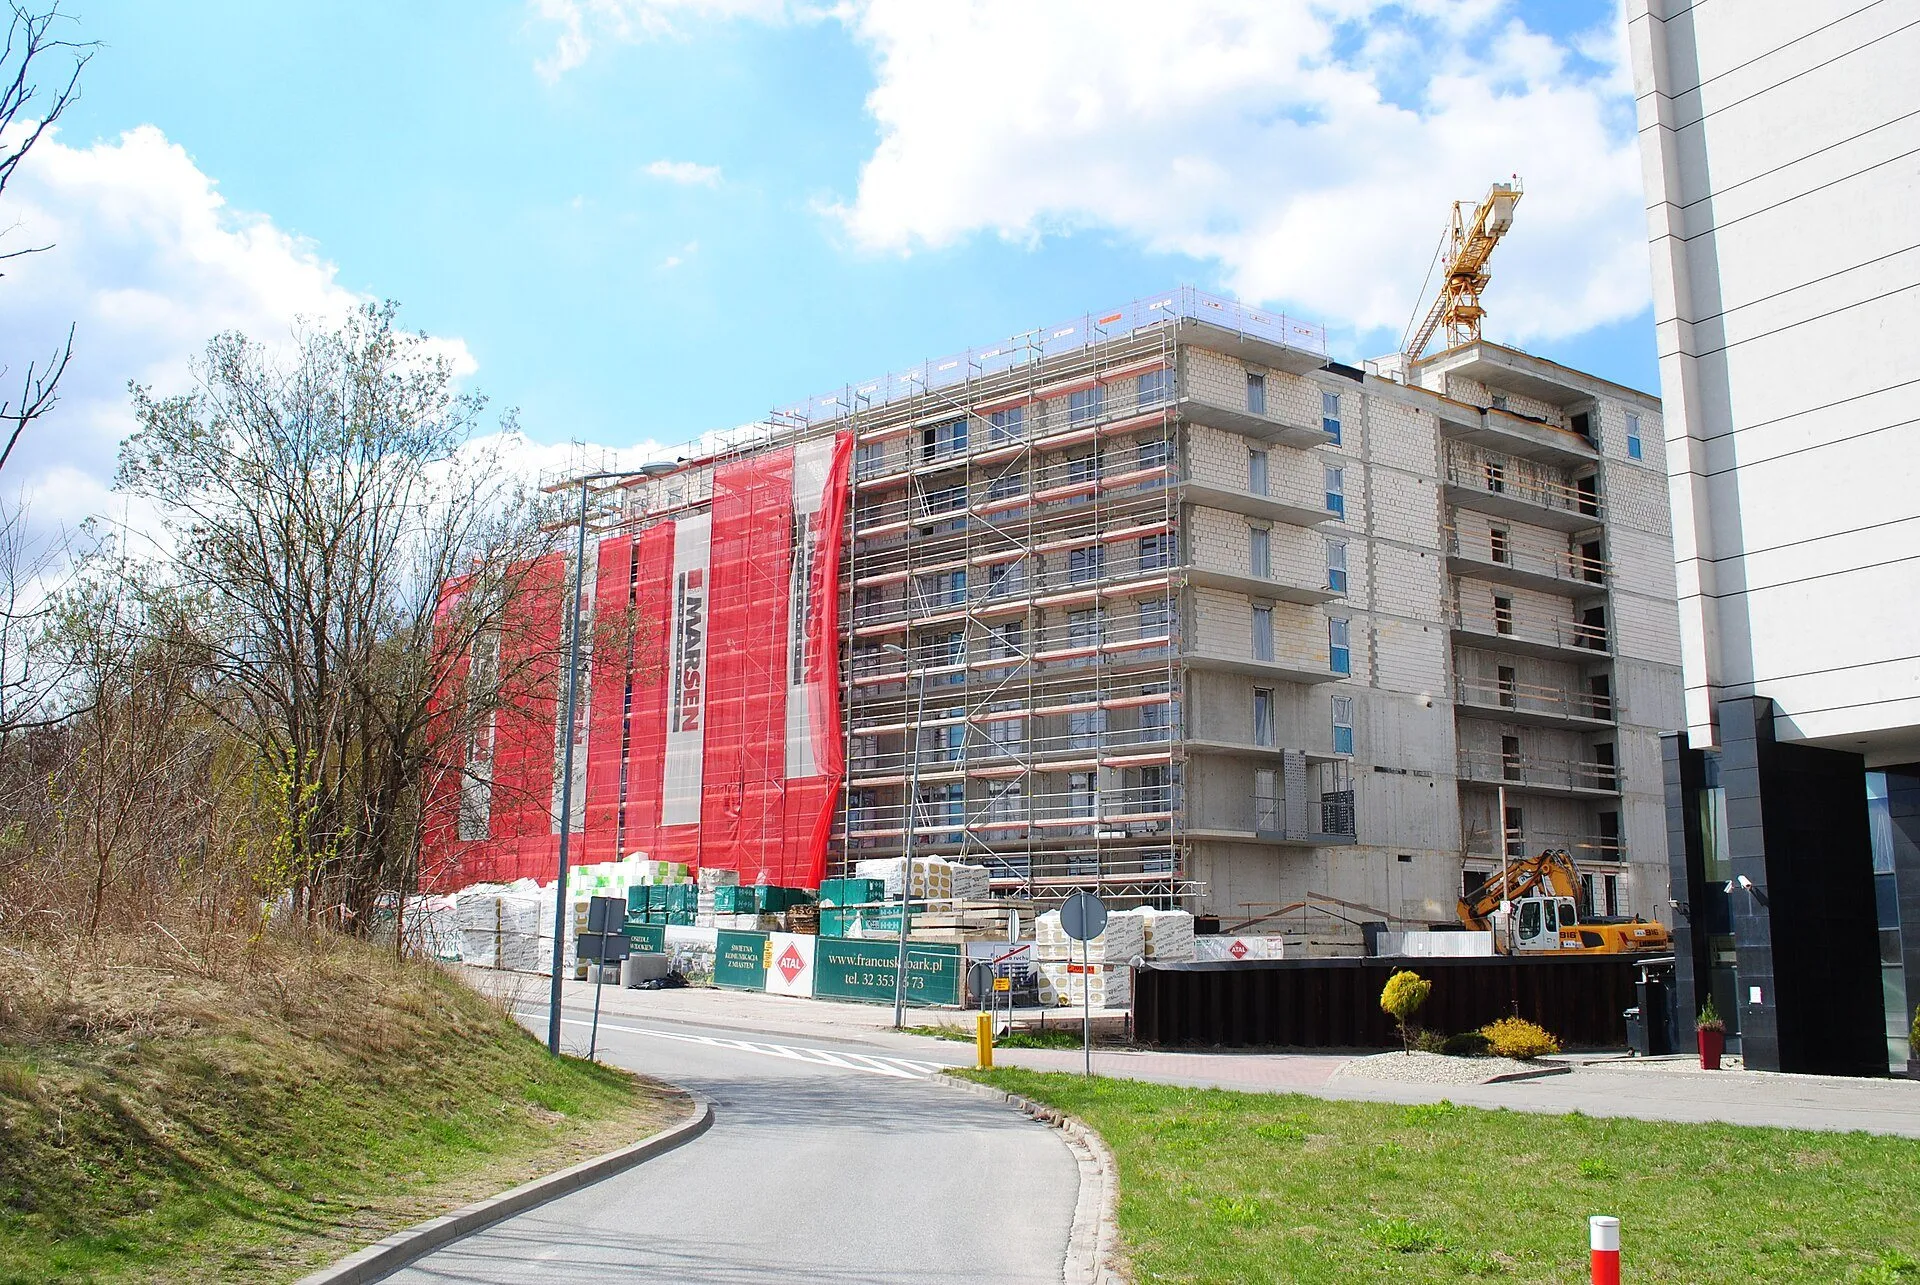
  • Francuska Park estate building in Katowice under construction

    Francuska Park

    Katowice

    Katowice2021

    Francuska Park

    Housing estate with underground car parks

    Analysis
    Car park general ventilation
    Tool
    FDS
    Developer
    ATAL

    What we checked

    • CO and LPG dilution in the car park
    • Airflow distribution in the car park
    • General ventilation of successive phases

    Photo: Wikimedia Commons, photo by Marek Mróz, CC BY-SA 4.0

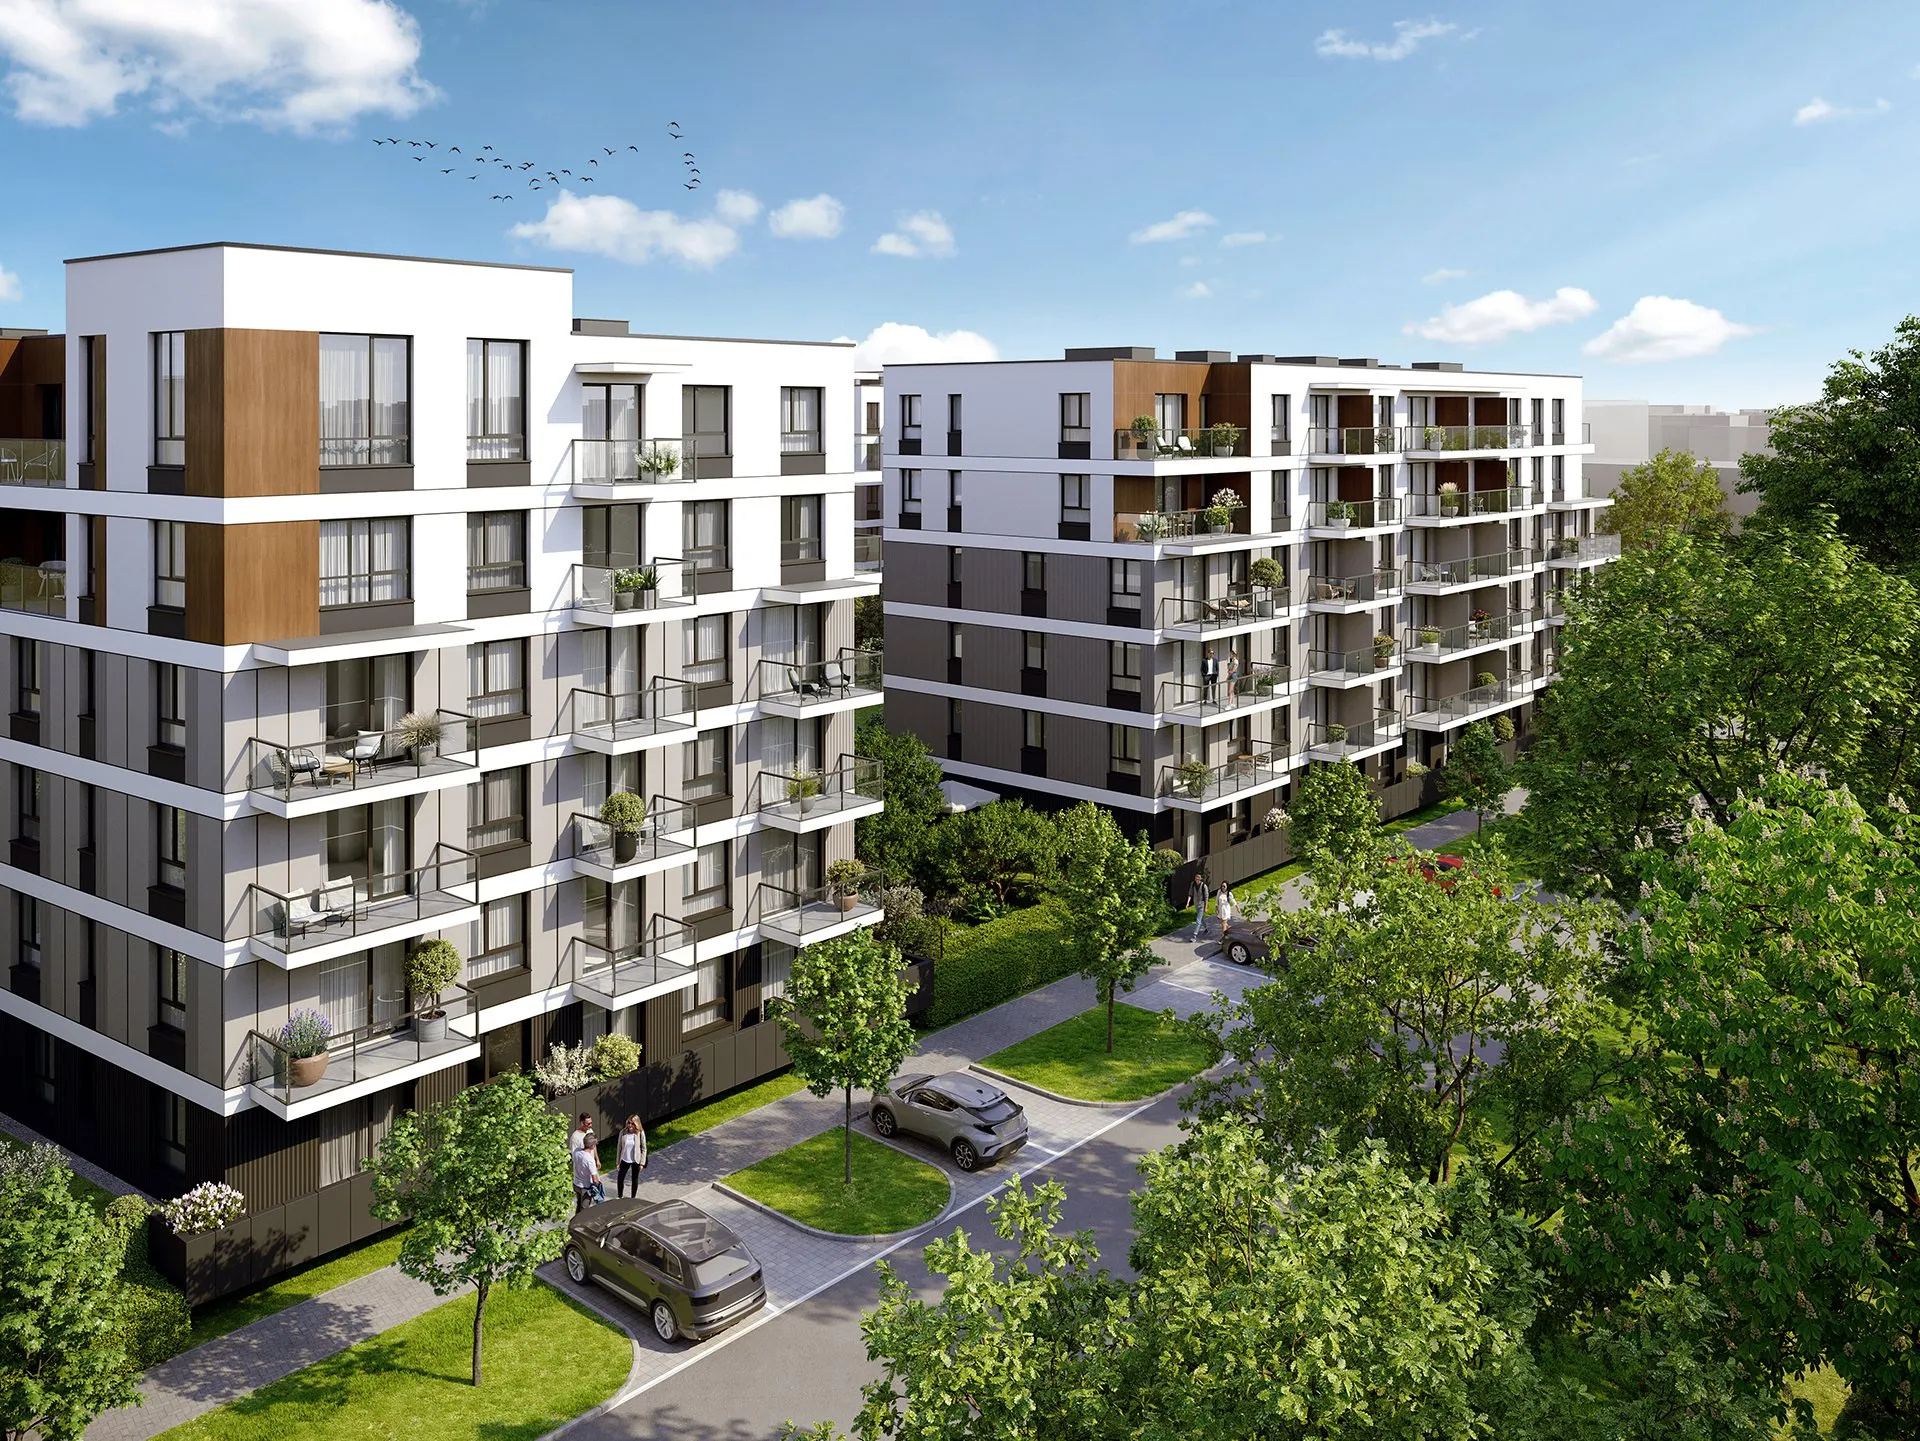
  • Visualisation of the Apartamenty Beethovena building in Warsaw's Sielce district

    Apartamenty Beethovena

    Warsaw

    Warsaw

    Apartamenty Beethovena

    Residential building, 6 storeys

    Analysis
    Car park general ventilation
    Tool
    FDS
    Car park
    1 basement level

    What we checked

    • CO and LPG dilution in the car park
    • Airflow distribution in the car park

    Visualisation: Dom Development S.A. (developer's materials)

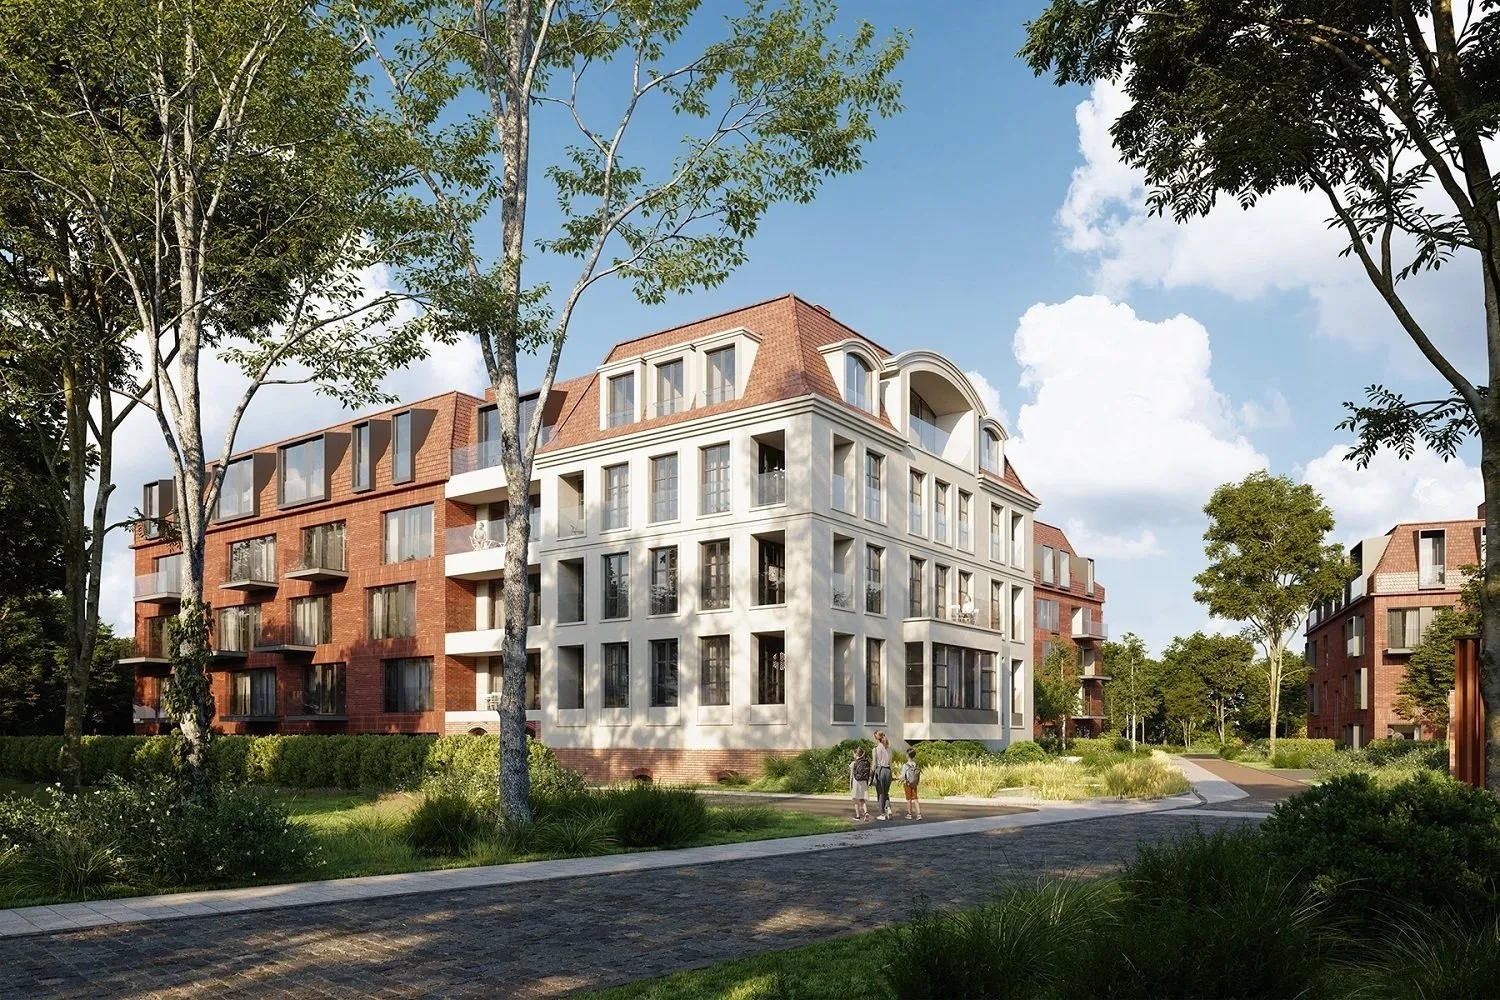
  • Visualisation of the Gaja Park estate on Pomorska Street in Gdańsk-Jelitkowo

    Gaja Park

    Gdańsk

    Gdańsk

    Gaja Park

    Housing estate, 81 apartments

    Analysis
    Car park general ventilation
    Tool
    FDS
    Buildings
    3
    Completed
    2024

    What we checked

    • CO and LPG dilution in the car park
    • Airflow distribution in the car park

    Visualisation: developer's materials, via korter.com.pl

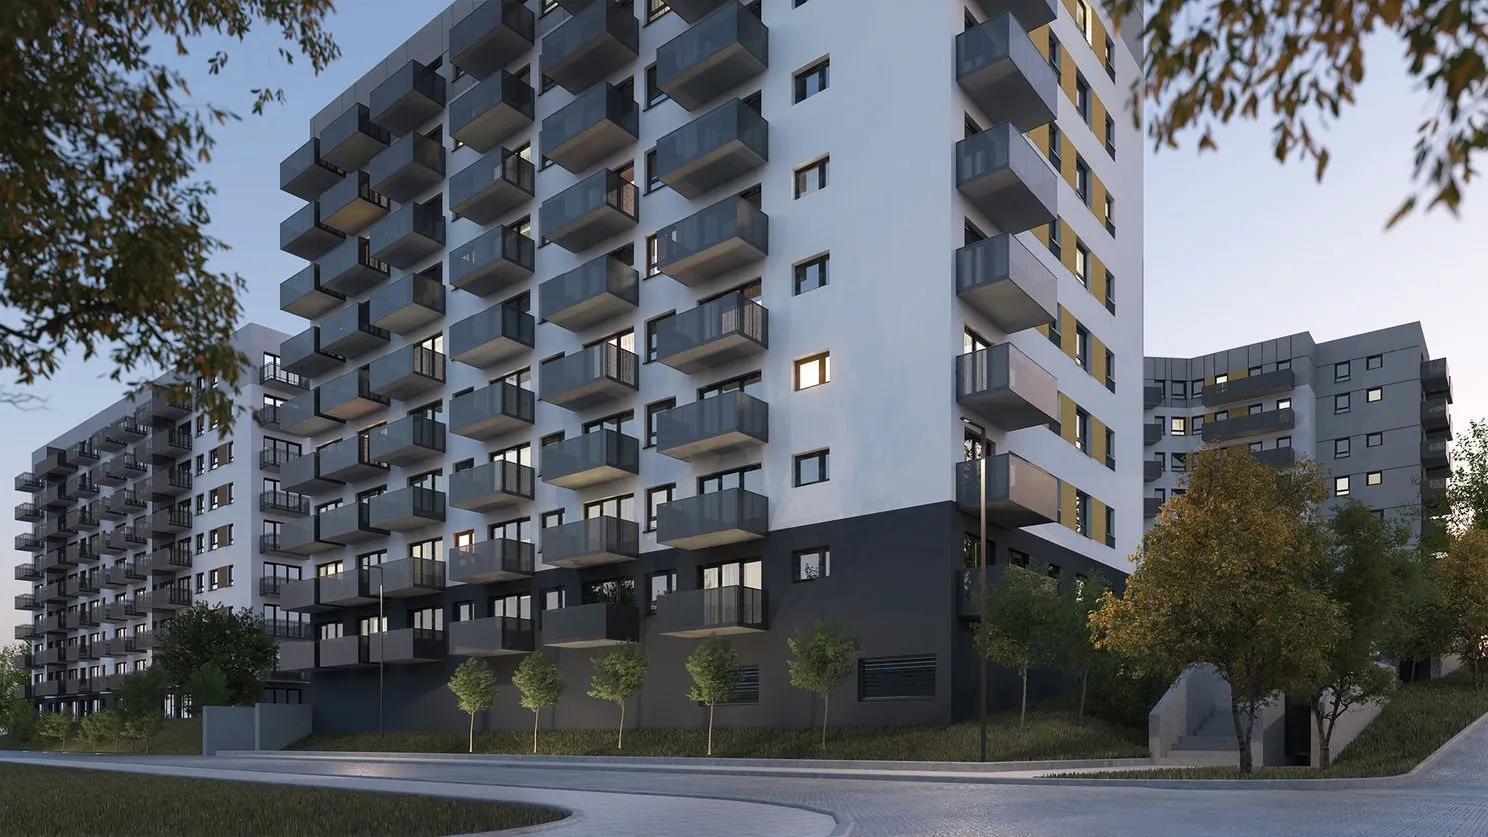
  • Visualisation of the Amsterdam estate in Warsaw's Targówek district

    Amsterdam estate

    Warsaw

    Warsaw2019

    Amsterdam estate

    Housing estate with an underground car park

    Analysis
    Car park general ventilation
    Tool
    FDS
    Apartments
    approx. 548
    Developer
    Dom Development

    What we checked

    • CO and LPG dilution in the car park
    • Airflow distribution in the car park

    Visualisation: nowawarszawa.pl, visualisation by Dom Development

  • Visualisation of the Verde estate in Poznań

    Verde estate

    Poznań

    Poznań2022

    Verde estate

    Housing estate, 3 buildings

    Analysis
    Car park general ventilation
    Tool
    FDS
    Apartments
    666
    Developer
    Murapol

    What we checked

    • CO and LPG dilution in the car park
    • Airflow distribution in the car park

    Visualisation: obido.pl, visualisation by Murapol

Thermal comfort

A key factor in how a space is perceived

Thermal comfort is one of the main factors that make occupants perceive conditions in air-conditioned spaces positively. Assessing comfort indices shows how well the general ventilation performs in different weather conditions, including extreme ones.

Because these factors interact, assessing comfort is complicated - comfortable conditions cannot be defined unambiguously for an individual occupant. That is why we use statistical indices.

  • activity level
  • clothing
  • ambient temperature
  • air velocity
  • humidity and thermal radiation
  • individual perception of temperature (acclimatisation)
PMV index scale - from cold to hot

Seven-point PMV scale (Predicted Mean Vote)

Indices

PMV and PPD - measures of comfort

PMV

Predicted Mean Vote

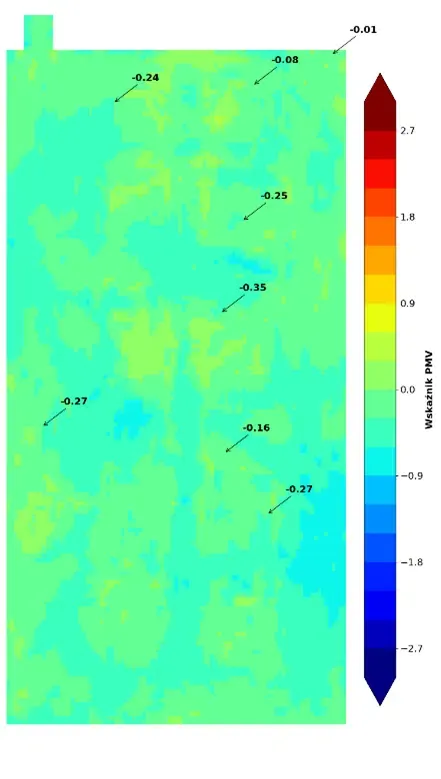
The predicted mean thermal sensation vote on a seven-point scale. ASHRAE 55 requires PMV to stay between −0.5 and +0.5, which corresponds to fewer than 10% of people dissatisfied.

PPD

Predicted Percentage of Dissatisfied

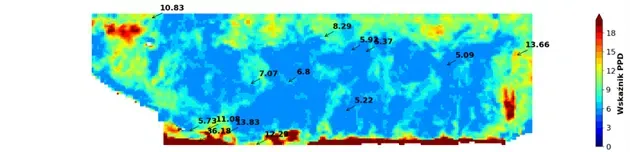
The predicted percentage of dissatisfied occupants. It gives a statistical estimate of the share of occupants who will find the thermal conditions uncomfortable and lets us classify the space as acceptable or not.

PMV distribution in a section through the room

PMV distribution map for the analysed space

Methodology

From CFD calculations to a comfort map

As with fire simulations, we use FDS - a tool for modelling low-speed flows of gases of varying density, which is also useful for assessing the performance of air conditioning and general ventilation. FDS output is the basis for calculating the comfort indices.

To process large amounts of data we use our own program written in Python, based on ASHRAE 55 and EN ISO 7730 (PN-EN ISO 7730). The script batch-reads air temperature and velocity from the FDS output files, combines them with quasi-constant parameters and builds a two-dimensional result matrix, which it then maps to a PMV and PPD distribution for every cell of the 3D model mesh. We also draw on the calculation methods of the CBE Thermal Comfort Tool from the University of California, Berkeley.

Knowledge base

Thermal comfort simulation in Ansys Fluent

Turbulence models, mesh validation and verification against international standards.

Need a comfort analysis?

Describe the space and the ventilation system - we will prepare a PMV/PPD analysis with a distribution map.